0. Opening — Setting the Stage
Throughout this series, we have been building a behavioral anomaly detection system for security telemetry.
Authentication events are collected from Windows endpoints, indexed in Elasticsearch, and transformed into behavioral features that describe how users normally authenticate over time. Unsupervised models are then trained to learn this normal behavior and assign anomaly scores to new events, which can later be used to generate alerts, enrich investigations, or drive automated responses.
So far, this work has been deliberately explored in notebooks: first to understand the data, then to design features, and finally to benchmark different unsupervised models under realistic constraints.
This post takes the next step: moving from experiments that work once to detections that can run repeatedly as part of a system.

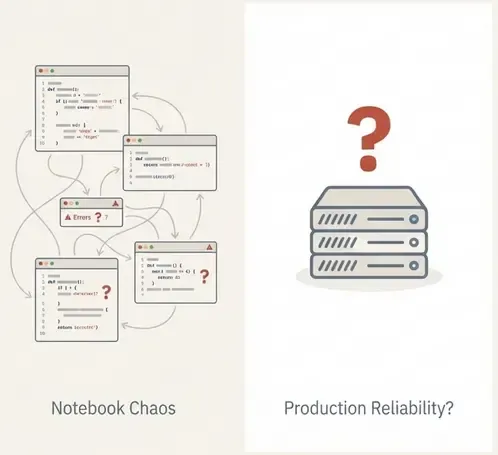
1. The Problem: Notebooks Are Not Systems
Notebooks are excellent for exploration—rapid iteration, visual inspection, and prototyping. However, a notebook is not a detection system.
In security environments, detection is defined by reliability over time, not just a one-off result. A notebook typically lacks:
- Deterministic execution: Cells can be run out of order.
- State management: Variables persist in memory unpredictably.
- Error handling: Failures often require manual intervention.
- Operational context: No built-in notion of retries, logging, or impact analysis.
For unsupervised detection, this is so important. Without labels to verify correctness, trust relies entirely on reproducibility and stability. If a detection changes, we must know if it’s due to a data shift or a code change. A notebook cannot guarantee this.
2. The Solution: Orchestration & Dagster Concepts
To bridge the gap between experiment and production, we need orchestration. Orchestration is not just scheduling; it is the control plane that manages dependencies, execution order, and state.
For this project, we use Dagster. While tools like Airflow or Prefect are also valid options, I chose Dagster for this proof of concept primarily because it is the tool where I have the most experience. Additionally, unlike traditional orchestrators that focus on “tasks” (doing things), Dagster focuses on Assets (producing things).
Key Concepts
Before building, it is important to understand the building blocks:
-
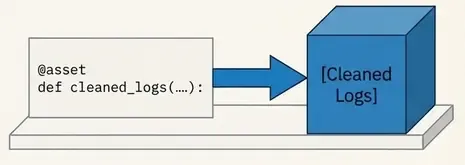
Software-Defined Assets (SDAs): The core unit of Dagster. An asset is a declaration of data that should exist (e.g., “the cleaned authentication logs”). You write code that produces this asset, and Dagster manages when to run it based on whether its inputs are up to date.
-
Ops and Graphs: While assets represent data, Ops represent the logical units of compute. Graphs connect these ops together. In modern Dagster, you often work primarily with Assets, but Ops are useful for functional tasks that don’t produce persistent data.
-
IO Managers: These handle the reading and writing of data. Instead of hardcoding
pd.read_csv()ores.index()inside your business logic, an IO Manager abstracts storage. This allows you to swap between local files (for testing) and Elasticsearch (for production) without changing the detection code. -
Resources: External dependencies like database connections or API clients. These are injected into your assets, making code testable and modular.
3. Designing the Detection Workflow
Now we can map our anomaly detection logic to these concepts. We are not just running a script; we are defining a graph of dependencies where data flows from raw events to finalized alerts.
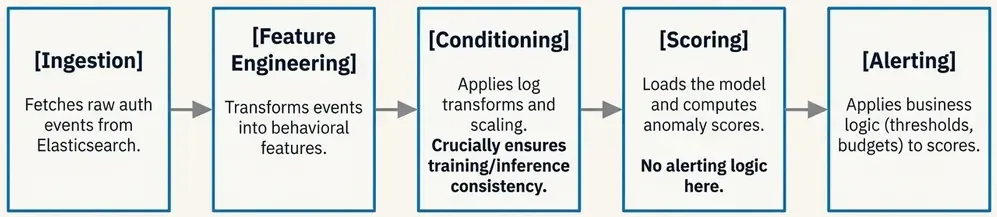
The minimal workflow for our authentication anomaly detection looks like this:
- Ingestion (Asset): Fetch raw authentication events from Elasticsearch.
- Feature Engineering (Asset): Transform raw events into behavioral features (e.g., login counts, distinct hosts).
- Conditioning (Asset): Apply log transforms and scaling using the parameters learned during training.
- Scoring (Asset): Load the versioned model and compute anomaly scores for each event.
- Thresholding & Alerting (Asset): Apply thresholds to determine which scores warrant an alert.
- Persistence (IO Manager): Write the results back to Elasticsearch for the SIEM to consume.
By structuring the detection this way, each step is independent. We can inspect the output of the “Feature Engineering” step without running the model. We can retry the “Scoring” step if it fails without re-fetching data.
Once the detection logic is clear, the next step is to encode it as an executable pipeline.
This is the transition: we stop thinking in terms of scripts and start thinking in terms of data products with dependencies.
In Dagster, this means defining:
- what data artifacts exist,
- how they are produced,
- and how they depend on each other.
3.1 Project Structure
A common mistake when adopting orchestration tools is to keep all logic in a single file.
Instead, we separate concerns explicitly.
This is the real project structure we have built:
elastic-ml-pipeline/
├── compose.yml                    # Docker orchestration (8 services)
├── Dockerfile.dagster             # Custom Dagster runtime
├── Dockerfile.mlflow              # MLflow with boto3 for MinIO
├── pyproject.toml                 # Dependencies & project config
├── data/                          # Training datasets
│   └── auth_features.parquet
├── etl/                          # Dagster pipeline code
│   ├── __init__.py
│   ├── definitions.py            # Central registry
│   ├── assets/                   # 5 pipeline stages
│   │   ├── ingestion.py         # Fetch from Elasticsearch
│   │   ├── features.py          # Feature engineering
│   │   ├── conditioning.py      # Scaling & transforms
│   │   ├── scoring.py           # Model inference
│   │   └── alerting.py          # Threshold & alert logic
│   ├── resources/               # External dependencies
│   │   ├── elastic.py           # Elasticsearch client
│   │   └── mlflow_models.py     # MLflow model loading
│   └── io_managers/             # Storage abstraction
│       └── elastic_io.py        # ES read/write manager
├── pipeline/                     # Training code
│   └── train.py                 # Model training with MLflow
├── scripts/                      # Utilities
│   ├── simulate_auth_events.py  # Event generator
│   ├── bulk_index_jsonl.py
│   └── create_windows_index.py
├── models/                       # Saved models (local)
├── notebooks/                    # Exploration & analysis
│   ├── 01_auth_logs_exploration.ipynb
│   ├── 02_train_ml.ipynb
│   └── 03_benchmarking_unsuppervised_models.ipynb
This structure enforces key principles:
- Separation of concerns: Training (
pipeline/) vs inference (etl/assets/) - Dependency injection: Resources are configured, not hardcoded
- Asset isolation: Each stage can be tested independently
- Infrastructure as code: Docker Compose defines the entire stack
3.2 Ingestion Asset — Fetching Raw Events
The first asset retrieves authentication events from Elasticsearch.
This asset does one thing only: fetch raw data for a given time window.
# etl/assets/ingestion.py
from dagster import asset, OpExecutionContext, Config
import pandas as pd
from etl.resources.elastic import ElasticsearchResource


class IngestionConfig(Config):
    """Configuration for ingestion asset."""
    hours_back: int = 24
    max_events: int = 10000


@asset(
    description="Raw authentication events fetched from Elasticsearch",
    group_name="ingestion",
)
def raw_auth_events(
    context: OpExecutionContext,
    config: IngestionConfig,
    elasticsearch: ElasticsearchResource,
) -> pd.DataFrame:
    """
    Fetch raw authentication events from Elasticsearch.

    Returns DataFrame with:
    - @timestamp, user.name, source.ip, event.outcome, etc.
    """
    context.log.info(f"Fetching events from last {config.hours_back} hours...")

    query = {
        "query": {
            "bool": {
                "must": [
                    {
                        "range": {
                            "@timestamp": {
                                "gte": f"now-{config.hours_back}h",
                                "lt": "now"
                            }
                        }
                    },
                    {"term": {"event.category": "authentication"}}
                ],
                "should": [
                    {"term": {"event.code": "4624"}},  # Successful logon
                    {"term": {"event.code": "4625"}},  # Failed logon
                ],
                "minimum_should_match": 1
            }
        },
        "sort": [{"@timestamp": {"order": "desc"}}]
    }

    df = elasticsearch.search_to_dataframe(
        index="winlogbeat-*",
        query=query,
        size=config.max_events
    )

    context.log.info(f"✅ Retrieved {len(df)} events")
    return df
Key design decisions:
- ConfigurableResource pattern: Time window is parameterized via
IngestionConfig - Field flattening: Nested Elasticsearch fields (
event.outcome) are automatically flattened - No business logic: This asset only fetches; transformation happens downstream
- Logging: Every step logs for observability
3.3 Feature Engineering Asset
This asset transforms raw events into behavioral features.
It reuses exactly the same logic developed in the notebooks.
# etl/assets/features.py
from dagster import asset, OpExecutionContext
import pandas as pd
import numpy as np


@asset(
    description="Behavioral features aggregated per user",
    group_name="feature_engineering",
)
def auth_features(
    context: OpExecutionContext,
    raw_auth_events: pd.DataFrame,
) -> pd.DataFrame:
    """
    Transform raw events into behavioral features.

    Features generated:
    - hour: Average hour of login
    - dayofweek: Average day of week
    - is_failure: Failure rate
    - user_login_count: Total login attempts
    - user_ip_count: Distinct IPs used
    """
    if raw_auth_events.empty:
        context.log.warning("No raw events to process")
        return pd.DataFrame(columns=[
            "hour", "dayofweek", "is_failure",
            "user_login_count", "user_ip_count",
        ])

    df = raw_auth_events.copy()

    # Parse timestamp
    if df['@timestamp'].dtype == 'object':
        df['@timestamp'] = pd.to_datetime(df['@timestamp'])

    # Extract temporal features
    df['hour'] = df['@timestamp'].dt.hour
    df['dayofweek'] = df['@timestamp'].dt.dayofweek
    df['is_failure'] = (df['event.outcome'] == 'failure').astype(int)

    # Aggregate by user
    features = (
        df.groupby('user.name')
        .agg({
            'hour': 'mean',
            'dayofweek': 'mean',
            'is_failure': 'mean',
            'user.name': 'count',
            'source.ip': 'nunique'
        })
        .rename(columns={
            'user.name': 'user_login_count',
            'source.ip': 'user_ip_count'
        })
        .reset_index()
    )

    context.log.info(f"✅ Generated features for {len(features)} users")
    return features
Why this matters:
- Deterministic: Same input always produces same output
- Versioned: Feature logic changes are visible in git
- Testable: Can be unit tested with synthetic data
- Traceable: Dagster tracks lineage from raw events to features
3.4 Conditioning Asset — Ensuring Training/Inference Consistency
One of the most common production errors in ML systems is mismatched preprocessing.
Dagster makes this explicit by modeling conditioning as its own asset.
# etl/assets/conditioning.py
from dagster import asset, OpExecutionContext
import numpy as np
import pandas as pd
from etl.resources.mlflow_models import MLflowResource


@asset(
    description="Conditioned features with log transforms and scaling",
    group_name="preprocessing",
)
def conditioned_features(
    context: OpExecutionContext,
    auth_features: pd.DataFrame,
    mlflow: MLflowResource,
) -> pd.DataFrame:
    """
    Apply preprocessing transformations using versioned artifacts.

    Steps:
    1. Log1p transform on count features
    2. StandardScaler from MLflow (trained during model training)
    """
    if auth_features.empty:
        context.log.warning("No features to condition")
        return pd.DataFrame()

    df = auth_features.copy()

    # Log transform count features (reduce skewness)
    for col in ["user_login_count", "user_ip_count"]:
        df[col] = np.log1p(df[col])
        context.log.info(f"Applied log1p to {col}")

    # Load scaler from MLflow (versioned artifact)
    scaler = mlflow.load_scaler()
    scaled = scaler.transform(df)

    # Validate no NaN/Inf after scaling
    if np.isnan(scaled).any() or np.isinf(scaled).any():
        context.log.error("Conditioning produced NaN/Inf values!")
        raise ValueError("Invalid conditioning output")

    result = pd.DataFrame(scaled, columns=df.columns)
    context.log.info(f"✅ Conditioned {len(result)} samples")

    return result
This guarantees:
- Same preprocessing: Scaler loaded from MLflow matches training exactly
- Training/serving parity: No manual syncing of preprocessing parameters
- Validation: Explicit checks for data quality issues
- Versioning: When scaler changes, Dagster knows downstream assets need refresh
3.5 Scoring Asset — Applying the Model
The scoring asset is deliberately simple.
It does not decide what is anomalous. It only computes scores.
# etl/assets/scoring.py
from dagster import asset, OpExecutionContext
import pandas as pd
import numpy as np
import torch
from etl.resources.mlflow_models import MLflowResource


@asset(
    description="Anomaly scores computed using production model",
    group_name="detection",
)
def anomaly_scores(
    context: OpExecutionContext,
    conditioned_features: pd.DataFrame,
    mlflow: MLflowResource,
) -> pd.DataFrame:
    """
    Compute anomaly scores using the champion model from MLflow.

    Uses reconstruction error from autoencoder as anomaly score.
    """
    if conditioned_features.empty:
        context.log.warning("No features to score")
        return pd.DataFrame(columns=["reconstruction_error"])

    # Load production model (aliased as "champion")
    model = mlflow.load_model(alias="champion")
    model.eval()

    # Compute reconstruction error
    X = torch.FloatTensor(conditioned_features.values)

    with torch.no_grad():
        reconstructed = model(X)
        errors = torch.mean((X - reconstructed) ** 2, dim=1).numpy()

    # Log score distribution for monitoring
    context.log.info(f"Score stats: mean={errors.mean():.4f}, "
                    f"std={errors.std():.4f}, "
                    f"max={errors.max():.4f}")

    # Log top 10 anomalies for inspection
    top_idx = np.argsort(errors)[-10:]
    context.log.info(f"Top 10 anomaly scores: {errors[top_idx]}")

    result = pd.DataFrame({
        "reconstruction_error": errors
    })

    context.log.info(f"✅ Scored {len(result)} samples")
    return result
Key design choices:
- Model loading by alias: Always uses
championmodel, not hardcoded paths - Separation of concerns: Only computes scores, no thresholds
- Observability: Logs score distribution for drift monitoring
- Stateless: Model inference has no side effects
3.6 Alerting Asset — Applying Operational Constraints
Alerting is where business logic enters.
Here we apply alert budgets, percentiles, or fixed thresholds.
# etl/assets/alerting.py
from dagster import asset, OpExecutionContext, Config
import pandas as pd
import numpy as np


class AlertingConfig(Config):
    """Configuration for alerting thresholds."""
    percentile_threshold: float = 99.5


@asset(
    description="Alerts generated from anomaly scores",
    group_name="detection",
    io_manager_key="elasticsearch_io_manager",  # Write to Elasticsearch
)
def anomaly_alerts(
    context: OpExecutionContext,
    config: AlertingConfig,
    anomaly_scores: pd.DataFrame,
) -> pd.DataFrame:
    """
    Apply threshold and classify severity.

    Severity levels:
    - critical: > P99.9
    - high: > P99.5
    - medium: > P99.0
    """
    if anomaly_scores.empty:
        context.log.warning("No scores to alert on")
        return pd.DataFrame()

    scores = anomaly_scores["reconstruction_error"].values

    # Compute percentile threshold
    threshold = np.percentile(scores, config.percentile_threshold)
    context.log.info(f"Alert threshold (P{config.percentile_threshold}): {threshold:.4f}")

    # Classify severity
    def classify_severity(score):
        if score > np.percentile(scores, 99.9):
            return "critical"
        elif score > np.percentile(scores, 99.5):
            return "high"
        elif score > np.percentile(scores, 99.0):
            return "medium"
        else:
            return "low"

    alerts = pd.DataFrame({
        "score": scores,
        "threshold": threshold,
        "is_alert": (scores >= threshold).astype(int),
        "severity": [classify_severity(s) for s in scores],
        "timestamp": pd.Timestamp.now().isoformat()
    })

    alert_count = alerts["is_alert"].sum()
    context.log.info(f"✅ Generated {alert_count} alerts from {len(alerts)} scores")

    return alerts
Why this is an asset:
- Tunable thresholds: Can adjust percentile without retraining
- Severity classification: Business logic separated from model
- Persistence:
io_manager_keywrites directly to Elasticsearch - Historical tracking: All alerts are versioned and auditable
3.7 Wiring Everything Together
Finally, all assets are registered in a single place:
# etl/definitions.py
from dagster import Definitions

# Import resources
from etl.resources.elastic import elasticsearch_resource
from etl.resources.mlflow_models import mlflow_resource

# Import IO managers
from etl.io_managers.elastic_io import elasticsearch_io_manager

# Import assets
from etl.assets.ingestion import raw_auth_events
from etl.assets.features import auth_features
from etl.assets.conditioning import conditioned_features
from etl.assets.scoring import anomaly_scores
from etl.assets.alerting import anomaly_alerts


# Define the Dagster definitions
definitions = Definitions(
    assets=[
        # Detection pipeline (5 stages)
        raw_auth_events,
        auth_features,
        conditioned_features,
        anomaly_scores,
        anomaly_alerts,
    ],
    resources={
        # Elasticsearch client for searching and indexing
        "elasticsearch": elasticsearch_resource,

        # MLflow client for model loading
        "mlflow": mlflow_resource,

        # IO Manager for persisting assets to Elasticsearch
        "elasticsearch_io_manager": elasticsearch_io_manager.configured({
            "url": "http://elasticsearch:9200",
            "index_prefix": "ml-pipeline-",
        }),
    },
)
At this point:
- The pipeline is executable via Dagster UI
- Dependencies are explicit and enforced
- Failures are isolated to specific assets
- Outputs are inspectable at each stage
- The entire lineage is visualized
The notebook is no longer the system. It is just where the system was designed.
Why This Matters
Nothing about the model changed.
What changed is control:
- when code runs,
- why it runs,
- and what depends on it.
This is the difference between having a model and operating a detection.
In the next section, we will introduce model and artifact versioning with MLflow, and show how training, promotion, and inference fit cleanly into this Dagster-based workflow.
That is where experimentation becomes governed change — and where this pipeline starts to look like something you can actually trust in production.
4. Model Lifecycle Management with MLflow
So far, the pipeline answers one question:
How do we run detection reliably?
The next question is just as important:
How do we manage models over time without losing control?
In notebooks, models are often treated as files:
model_final.pkl, model_v2.pt, really_final_this_one.pt.
That approach does not scale.
In a detection system, models are artifacts with history, and that history matters.
4.1 Why Model Management Matters in Unsupervised Detection
Unsupervised models introduce a subtle risk. When the system flags an anomaly, or when the number of anomalies spikes, we face the attribution problem.
Theoretically, a change in output can come from three distinct sources:
- Data Drift
- Concept Drift
- Model Drift
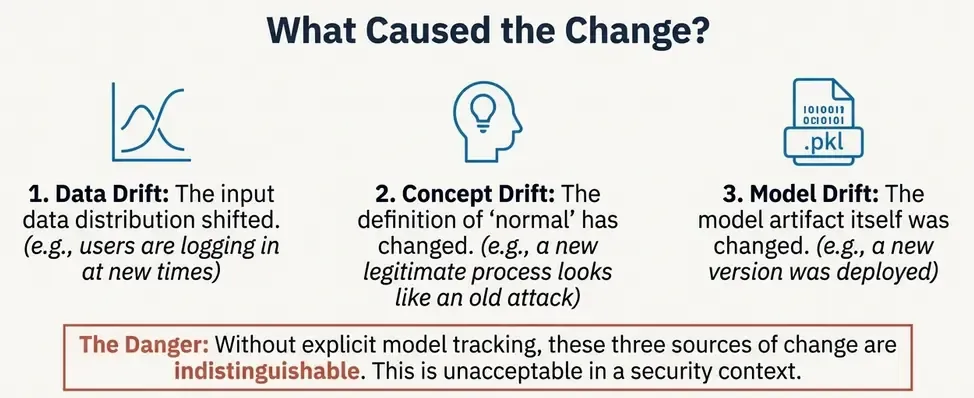
This leads to dangerous situations:
- silent changes in alert volume,
- unexplained shifts in anomaly scores,
- models being retrained and deployed without traceability.
In security, this is unacceptable.
We need to know:
- which model produced which alerts,
- with which data and parameters,
- and when it was promoted to production.
This is exactly what MLflow is designed for.
4.2 What MLflow Is (and What It Is Not)
MLflow is not an orchestrator. It does not schedule jobs or run pipelines.
Instead, MLflow provides:
- experiment tracking,
- artifact versioning,
- and model registry capabilities.
Think of it as the source of truth for models, not the system that runs them.
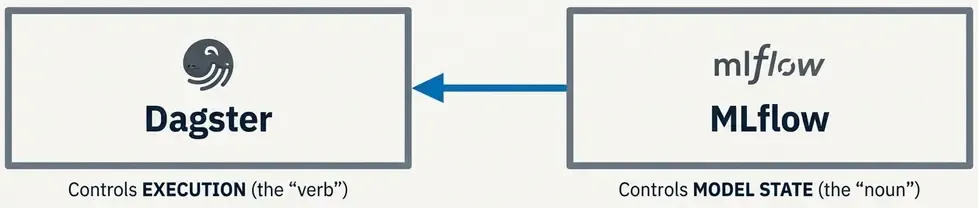
In this architecture:
- Dagster controls execution,
- MLflow controls model state.
They solve different problems and complement each other well.
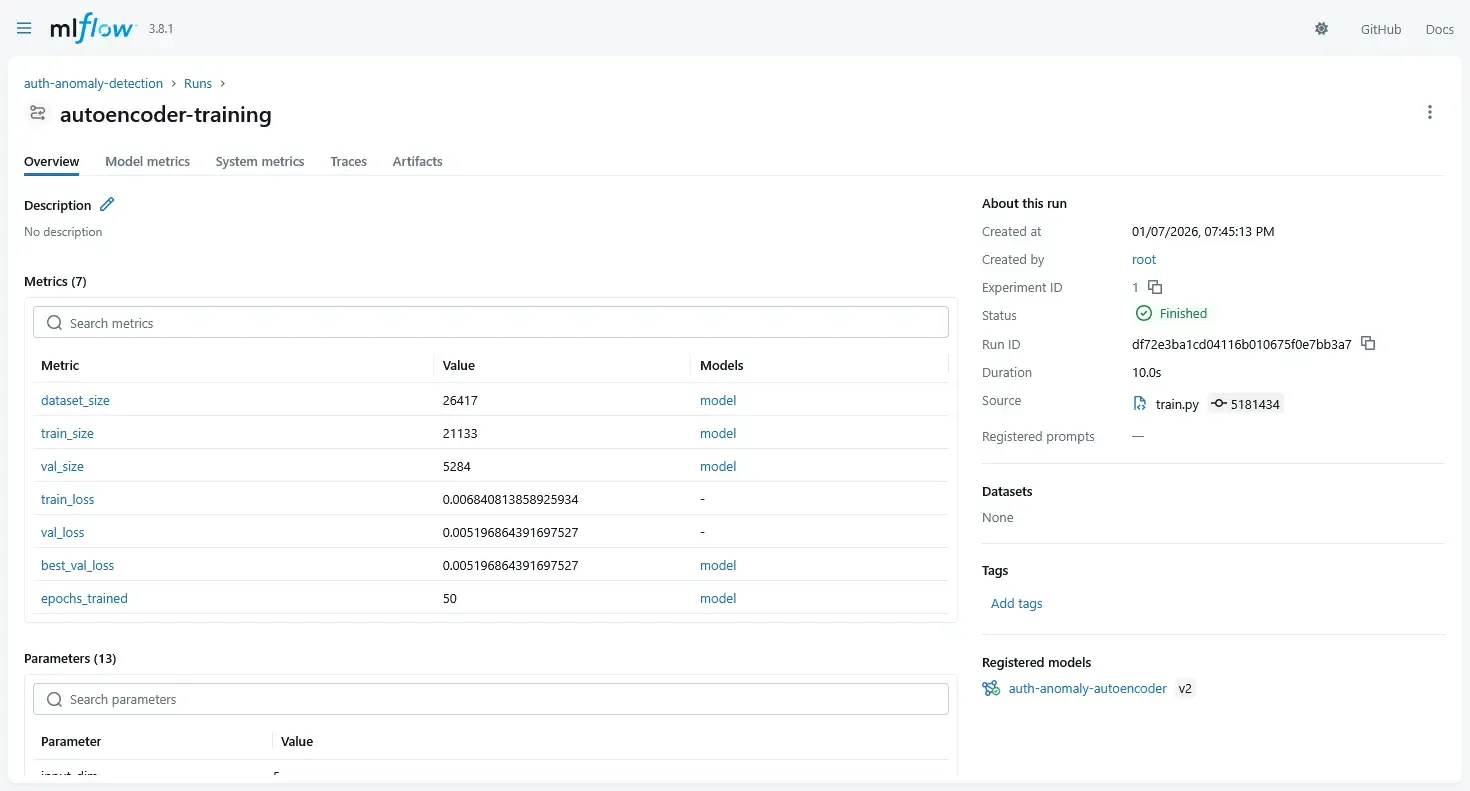
4.3 Tracking Experiments: The Formula for Reproducibility
Theoretically, a machine learning model is not just a binary file. It is the result of a function:
If you only save the model binary, you lose the context of how it was created. During training (which can happen in notebooks or batch jobs), we must log all three components.
Real training code from our pipeline:
# pipeline/train.py (simplified)
import mlflow
import mlflow.pytorch
import torch
import pandas as pd
from sklearn.preprocessing import StandardScaler
# Configure MLflow
mlflow.set_tracking_uri("http://mlflow:5000")
mlflow.set_experiment("auth-anomaly-detection")
with mlflow.start_run(run_name="autoencoder-training"):
# Log parameters
mlflow.log_param("model_type", "autoencoder")
mlflow.log_param("input_dim", 5)
mlflow.log_param("latent_dim", 3)
mlflow.log_param("hidden_dim", 16)
mlflow.log_param("epochs", 50)
mlflow.log_param("learning_rate", 1e-3)
mlflow.log_param("batch_size", 32)
# Train model
model = Autoencoder(input_dim=5, hidden_dim=16, latent_dim=3)
optimizer = torch.optim.Adam(model.parameters(), lr=1e-3)
# Training loop (with early stopping)
for epoch in range(50):
loss = train_epoch(model, train_loader, optimizer)
val_loss = validate(model, val_loader)
# Log metrics per epoch
mlflow.log_metric("train_loss", loss, step=epoch)
mlflow.log_metric("val_loss", val_loss, step=epoch)
if early_stopping_triggered:
break
# Log final model
mlflow.pytorch.log_model(
model,
artifact_path="model",
registered_model_name="auth-anomaly-autoencoder"
)
# Log preprocessing artifacts
mlflow.log_artifact("preprocessing/scaler.pkl")
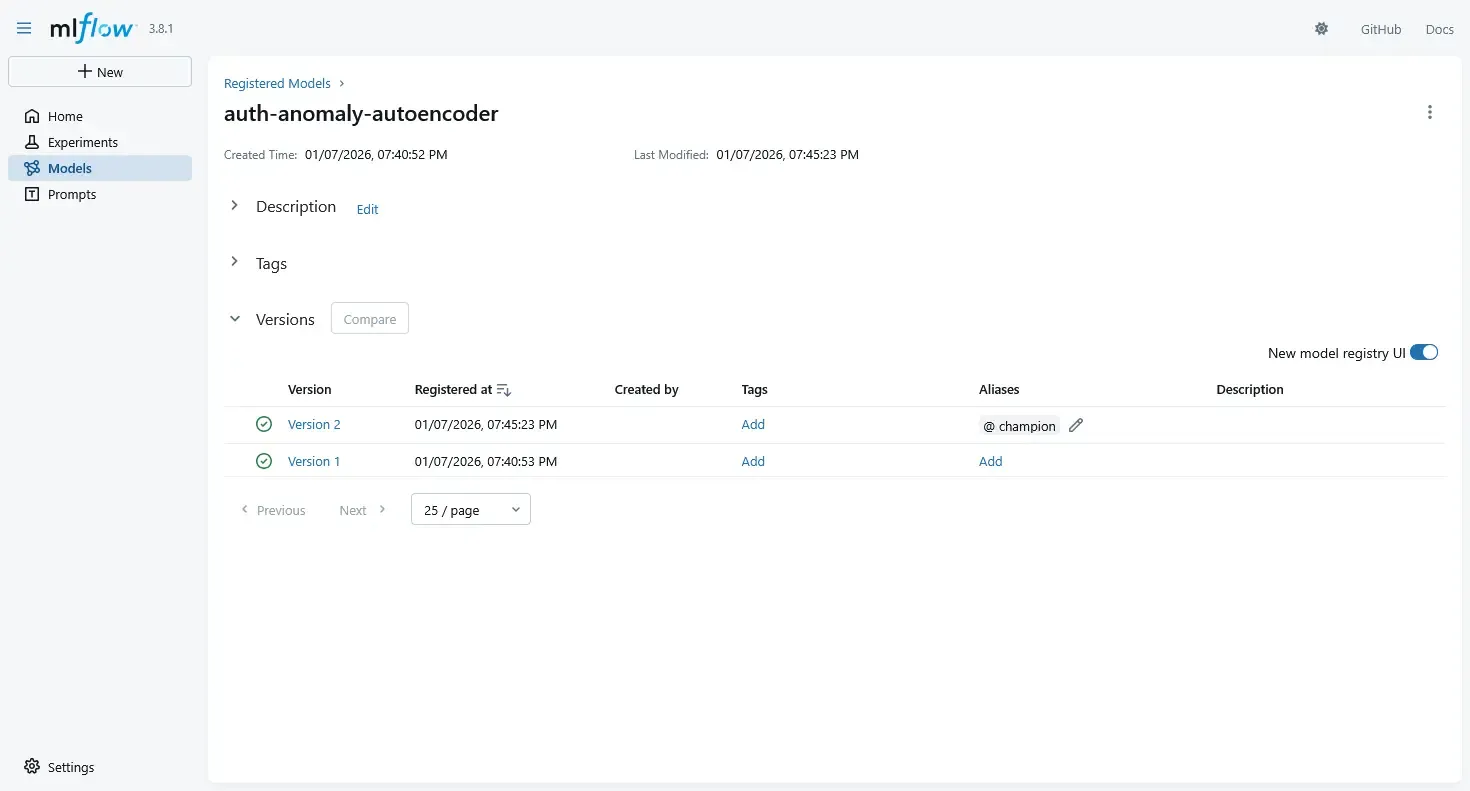
# Register model with alias (new API, replaces stages)
client = mlflow.MlflowClient()
model_version = client.get_latest_versions(
"auth-anomaly-autoencoder",
stages=["None"]
)[0]
# Promote to champion
client.set_registered_model_alias(
"auth-anomaly-autoencoder",
"champion",
model_version.version
)This gives us:
- Reproducibility: Every parameter logged
- Comparability: Compare experiments side-by-side
- Artifact tracking: Model + preprocessor versioned together
- Audit trail: Who trained what, when, with which data
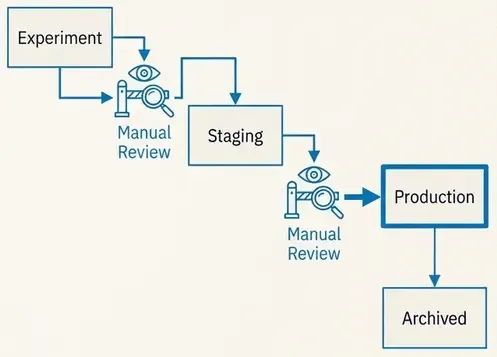
4.4 Using the MLflow Model Registry
Once experiments are logged, we promote models explicitly using the Model Registry.
Typical lifecycle stages:
StagingProductionArchived
Promotion is a decision, not a side effect of training.
For example:
- a model is trained and logged,
- benchmarked against previous models,
- manually reviewed,
- and only then promoted to
Production.
This avoids accidental deployments.
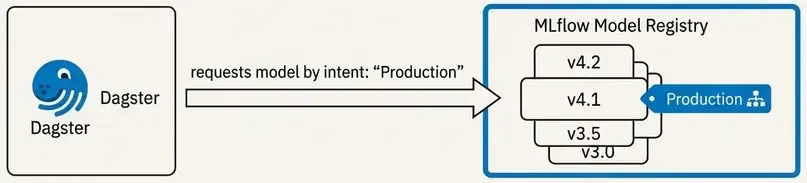
4.5 Loading Models in the Dagster Pipeline
Dagster does not load models from disk paths. It loads models by intent.

We define a resource that fetches the currently promoted production model.
# resources/models.py
import mlflow.pyfunc

def model_resource():
    return mlflow.pyfunc.load_model(
        model_uri="models:/auth_anomaly_model/Production"
    )
Now the pipeline always uses:
- the current production model,
- without hardcoding filenames,
- without redeploying code.
Model changes are decoupled from pipeline changes.
4.6 Training and Inference: Solving Training-Serving Skew
A critical design decision is to decouple training from inference.
Training is not part of the detection pipeline.
Instead, we have:
- A Training Pipeline: Batch, offline, resource-intensive.
- An Inference Pipeline: Frequent, deterministic, low-latency.
This separation helps solve Training-Serving Skew—the common failure mode where a model performs well in notebooks but fails in production because the input data processing differs. By treating the model and its preprocessors (like the scaler) as immutable artifacts, we ensure the inference pipeline behaves exactly like the training environment.
Dagster can orchestrate both, but they are different jobs with different guarantees.
4.7 Why This Matters in Practice
At this point, we have:
- deterministic execution (Dagster),
- versioned data transformations,
- explicit alert logic,
- and governed model evolution (MLflow).
This combination solves the hardest production problem in unsupervised ML:
When something changes, we can explain why.
In security, that is often more important than raw detection performance.
Where We Go Next
So far, everything still lives “inside the pipeline”.
But first, let’s talk about the infrastructure that makes this all possible.
5. Infrastructure: Docker Compose Architecture
A production ML pipeline requires multiple services working together. We use Docker Compose to orchestrate 8 services that form the complete system.
5.1 The Service Stack
# compose.yml (simplified)
services:
  elasticsearch: # Data storage & search
    image: docker.elastic.co/elasticsearch/elasticsearch:8.18.0
    environment:
      - discovery.type=single-node
      - xpack.security.enabled=false # Dev mode

  kibana: # Visualization & dashboards
    image: docker.elastic.co/kibana/kibana:8.18.0
    depends_on:
      - elasticsearch

  dagster-postgres: # Dagster metadata DB
    image: postgres:latest

  minio: # S3-compatible artifact storage
    image: minio/minio:latest
    command: server /data --console-address ":9001"

  mlflow: # Model registry & tracking
    build:
      dockerfile: Dockerfile.mlflow
    environment:
      - MLFLOW_SERVER_ALLOWED_HOSTS=* # Allow container networking
      - AWS_ACCESS_KEY_ID=minio
      - AWS_SECRET_ACCESS_KEY=minio12345
    command: >
      mlflow server
      --host 0.0.0.0
      --port 5000
      --backend-store-uri sqlite:////mlflow/mlflow.db
      --artifacts-destination s3://mlflow/
      --serve-artifacts

  dagster: # Orchestration web UI
    build:
      dockerfile: Dockerfile.dagster
    environment:
      - MLFLOW_TRACKING_URI=http://mlflow:5000
      - ELASTICSEARCH_URL=http://elasticsearch:9200
    command: dagster-webserver -h 0.0.0.0 -p 3000 -m etl.definitions

  dagster-daemon: # Background scheduler
    build:
      dockerfile: Dockerfile.dagster
    command: dagster-daemon run
5.2 Key Design Decisions
MLflow with SQLite + MinIO:
- Simplified from PostgreSQL backend to SQLite for reduced complexity
- MinIO provides S3-compatible storage for model artifacts
- Custom Dockerfile adds
boto3for S3 support
Network Isolation:
- Internal hostnames (
mlflow:5000,elasticsearch:9200) - Environment variables for service discovery
MLFLOW_SERVER_ALLOWED_HOSTS=*allows Docker hostname connections
Volume Persistence:
mlflow_db: SQLite database for experiment metadataminio_data: Model artifacts and scalersesdata: Elasticsearch indices (events + alerts)dagster_home: Pipeline run history
5.3 Starting the System
# Start all services
docker compose up -d
# Check health
docker compose ps
# View logs
docker compose logs -f dagster mlflow
# Access UIs
# Dagster: http://localhost:3000
# MLflow: http://localhost:5000
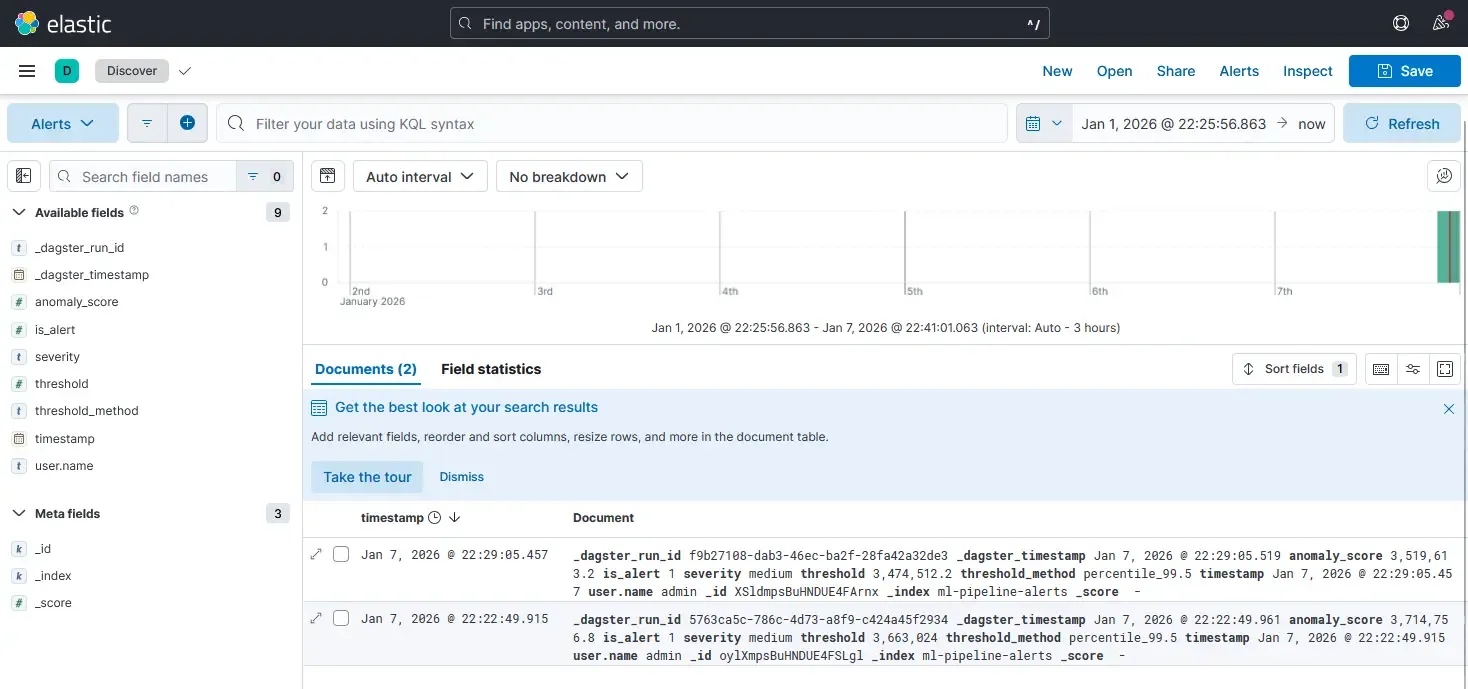
# Kibana: http://localhost:56016. From Scores to Signals: Closing the Loop with Elasticsearch
A score inside a pipeline is useless to a SOC. To become operational, scores must be persisted, searchable, and correlated with other signals. This is where we close the loop with Elasticsearch.
6.1 Persisting Scores & Schema Design
Unlike notebooks where results are discarded, a detection system treats scores as first-class data. We don’t overwrite original logs; we enrich and append scored results to a dedicated index.
A typical alert document preserves full context:
{
  "score": 0.8734,
  "threshold": 0.6521,
  "is_alert": 1,
  "severity": "high",
  "timestamp": "2026-01-07T20:15:32.123Z",
  "_dagster_run_id": "abc123-def456",
  "_dagster_timestamp": "2026-01-07T20:15:00.000Z"
}
This structure allows us to:
- Query alerts by severity or time range
- Correlate with original authentication events
- Trace back to specific pipeline runs
- Audit model versions and thresholds used
6.2 Writing Results from Dagster: The IO Manager Pattern
In Dagster, we use an IO Manager to handle persistence. This abstracts storage from detection logic.
# etl/io_managers/elastic_io.py
from dagster import IOManager, io_manager, OutputContext
import pandas as pd
from elasticsearch import Elasticsearch
from elasticsearch.helpers import bulk


class ElasticsearchIOManager(IOManager):
    def __init__(self, url: str, index_prefix: str):
        self.url = url
        self.index_prefix = index_prefix

    def _get_index_name(self, context: OutputContext) -> str:
        """Map asset names to ES indices."""
        asset_name = context.asset_key.path[-1]

        index_map = {
            "anomaly_alerts": f"{self.index_prefix}alerts",
            "anomaly_scores": f"{self.index_prefix}scores",
            "auth_features": f"{self.index_prefix}features",
        }

        return index_map.get(asset_name, f"{self.index_prefix}{asset_name}")

    def handle_output(self, context: OutputContext, obj: pd.DataFrame):
        """Write DataFrame to Elasticsearch."""
        if obj is None or obj.empty:
            context.log.warning("Empty output, skipping write")
            return

        index_name = self._get_index_name(context)
        es = Elasticsearch([self.url])

        # Convert to dict records
        records = obj.to_dict(orient="records")

        # Add metadata
        for record in records:
            record["_dagster_run_id"] = context.run_id
            record["_dagster_timestamp"] = pd.Timestamp.now().isoformat()

            # Clean NaN values
            record = {k: (None if pd.isna(v) else v)
                     for k, v in record.items()}

        # Bulk index
        actions = [{"_index": index_name, "_source": r} for r in records]
        success, failed = bulk(es, actions, refresh=True, raise_on_error=False)

        context.log.info(f"✅ Indexed {success} docs to {index_name}")


@io_manager(config_schema={"url": str, "index_prefix": str})
def elasticsearch_io_manager(init_context) -> ElasticsearchIOManager:
    config = init_context.resource_config
    return ElasticsearchIOManager(
        url=config["url"],
        index_prefix=config["index_prefix"],
    )
Key benefits:
- Separation of concerns: Assets don’t know about Elasticsearch
- Testability: Can swap for a mock IO manager in tests
- Configurability: Index names defined in one place
- Observability: All writes logged with metrics
5.3 Decoupling Alerting from Scoring
A critical design principle is that the model does not send alerts.
- The Model computes a score (0.0 to 1.0).
- The Pipeline applies a threshold (e.g., > 0.95).
- Elasticsearch/Kibana handles the actual alerting and visualization.
This separation allows us to tune thresholds or change alerting strategies without retraining the model. Analysts can visualize score distributions in Kibana and adjust sensitivity based on operational capacity, not just statistical metrics.
By indexing scores, we turn a mathematical output into an operational signal that can be correlated, searched, and acted upon.
What Remains
We now have:
- orchestrated execution,
- governed models,
- persisted scores,
- and operational visibility.
What remains is operational discipline: how this runs every day without breaking.
6. Operational Discipline: Running Without Breaking
A pipeline that runs once is a script. A pipeline that runs every hour for a year is a system. To survive in production, we need more than just code execution.
6.1 Handling Failure
Failures are inevitable—Elasticsearch times out, APIs flake, data arrives late.
- Transient Failures: Use Dagster’s retry policies for IO operations. If Elastic is down, wait and retry.
- Logic Failures: Fail fast. If the schema changes or validation fails, stop the pipeline immediately to prevent polluting the index with bad data.
6.2 Monitoring “Drift” Without Labels
In unsupervised learning, we cannot measure “accuracy” in real-time because we don’t have labels. Instead, we monitor distributions.
- Score Stability: If the average anomaly score jumps from 0.1 to 0.8 overnight, either an attack is happening, or (more likely) the data pipeline broke.
- Feature Shift: Track the statistical properties of inputs (e.g., number of unique IPs).
We treat these shifts as meta-alerts: alerts on the health of the detection system itself.
6.3 The Retraining Trap
A common anti-pattern is “automated retraining.” Do not do this. Unsupervised models can easily “learn” an attack if it happens frequently enough during the training window.
The Golden Rule: Retraining is a manual promotion process.
- Train candidate model.
- Compare score distributions against the current production model.
- Manually promote if the behavior is expected.
7. Testing & Validation: End-to-End Workflow
7.1 Data Generation
# Generate 7 days of synthetic authentication events
uv run python3 scripts/simulate_auth_events.py \
  --backfill-days 7 \
  --backfill-events-per-day 500 \
  --anomaly-rate 0.05 \
  --backfill-only
7.2 Model Training
# Train autoencoder and register to MLflow
uv run python3 pipeline/train.py
7.3 Pipeline Execution
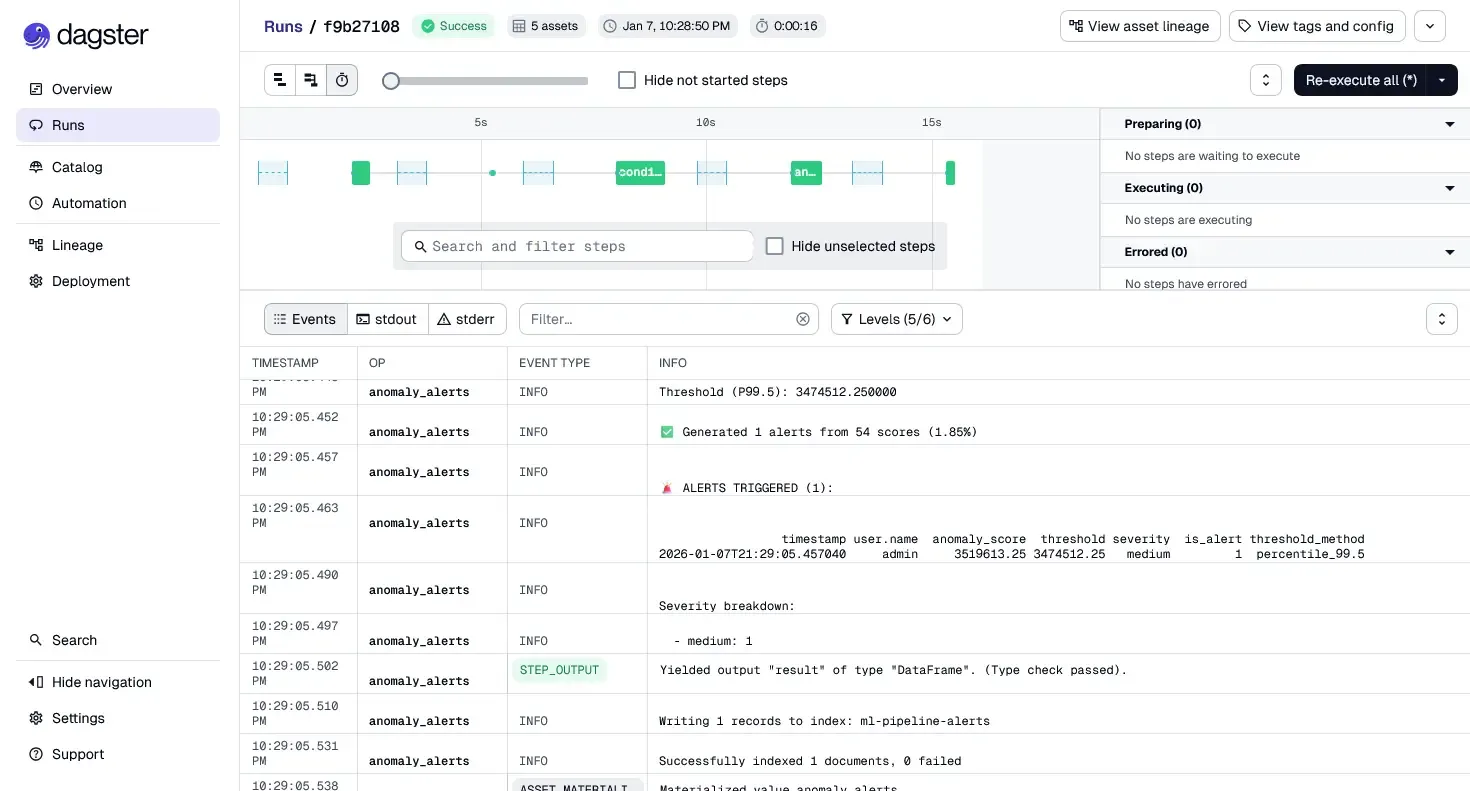
- Open Dagster UI:
http://localhost:3000 - Navigate to Assets view
- Select all 5 assets and click “Materialize all”
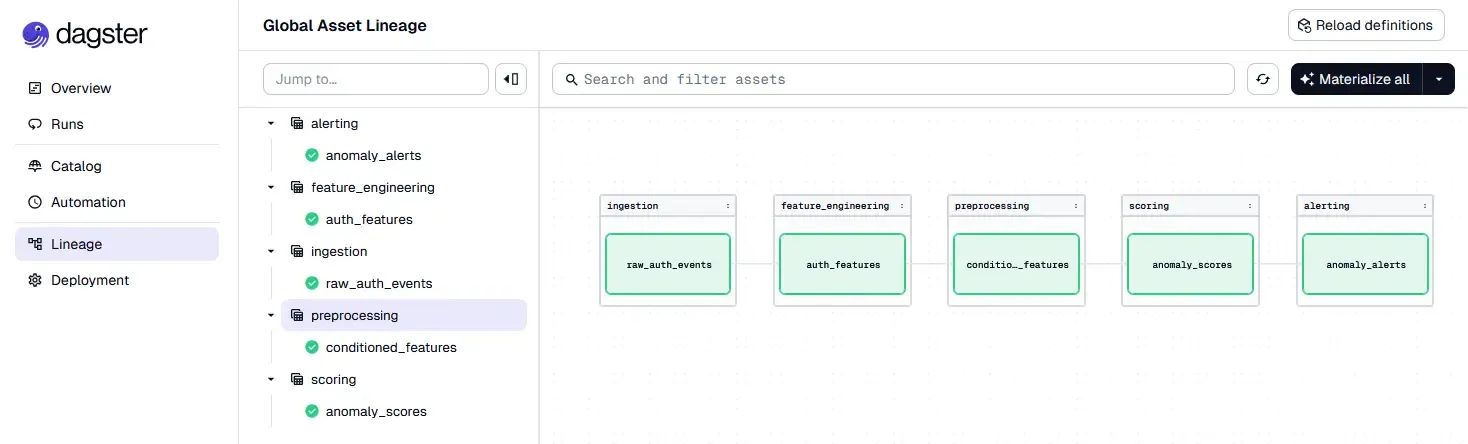
- Monitor execution logs and lineage graph
7.4 Verification
# Verify alerts in Elasticsearch
curl "localhost:9200/ml-pipeline-alerts/_search?pretty"
Closing Thoughts
We have moved from a fragile notebook.ipynb to a robust, orchestrated system. We have:
- Decoupled logic (Assets) from storage (IO Managers)
- Versioned our models and preprocessing (MLflow)
- Orchestrated execution with dependency management (Dagster)
- Persisted results for operational consumption (Elasticsearch)
- Containerized the entire stack (Docker Compose)
What This System Provides
✅ Reproducibility: Every run traced to code, data, and model versions
✅ Reliability: Failures isolated and retryable
✅ Observability: Full lineage from events to alerts
✅ Auditability: Model changes explicit and governed
✅ Operability: Integrates with SIEM workflows
Repository & Resources
Full implementation: Available in repository with:
etl/- Complete 5-stage pipelinepipeline/train.py- Training with MLflowcompose.yml- 8-service infrastructureTECHNICAL_GUIDE.md- Detailed setup guideassets/images/- Architecture screenshots
This is the difference between data science and security engineering.

Full code available: engineering-security-ml